A one-stop-destination for data analytics, engineering and everything in between
A one-stop-destination for data analytics, engineering and everything in between
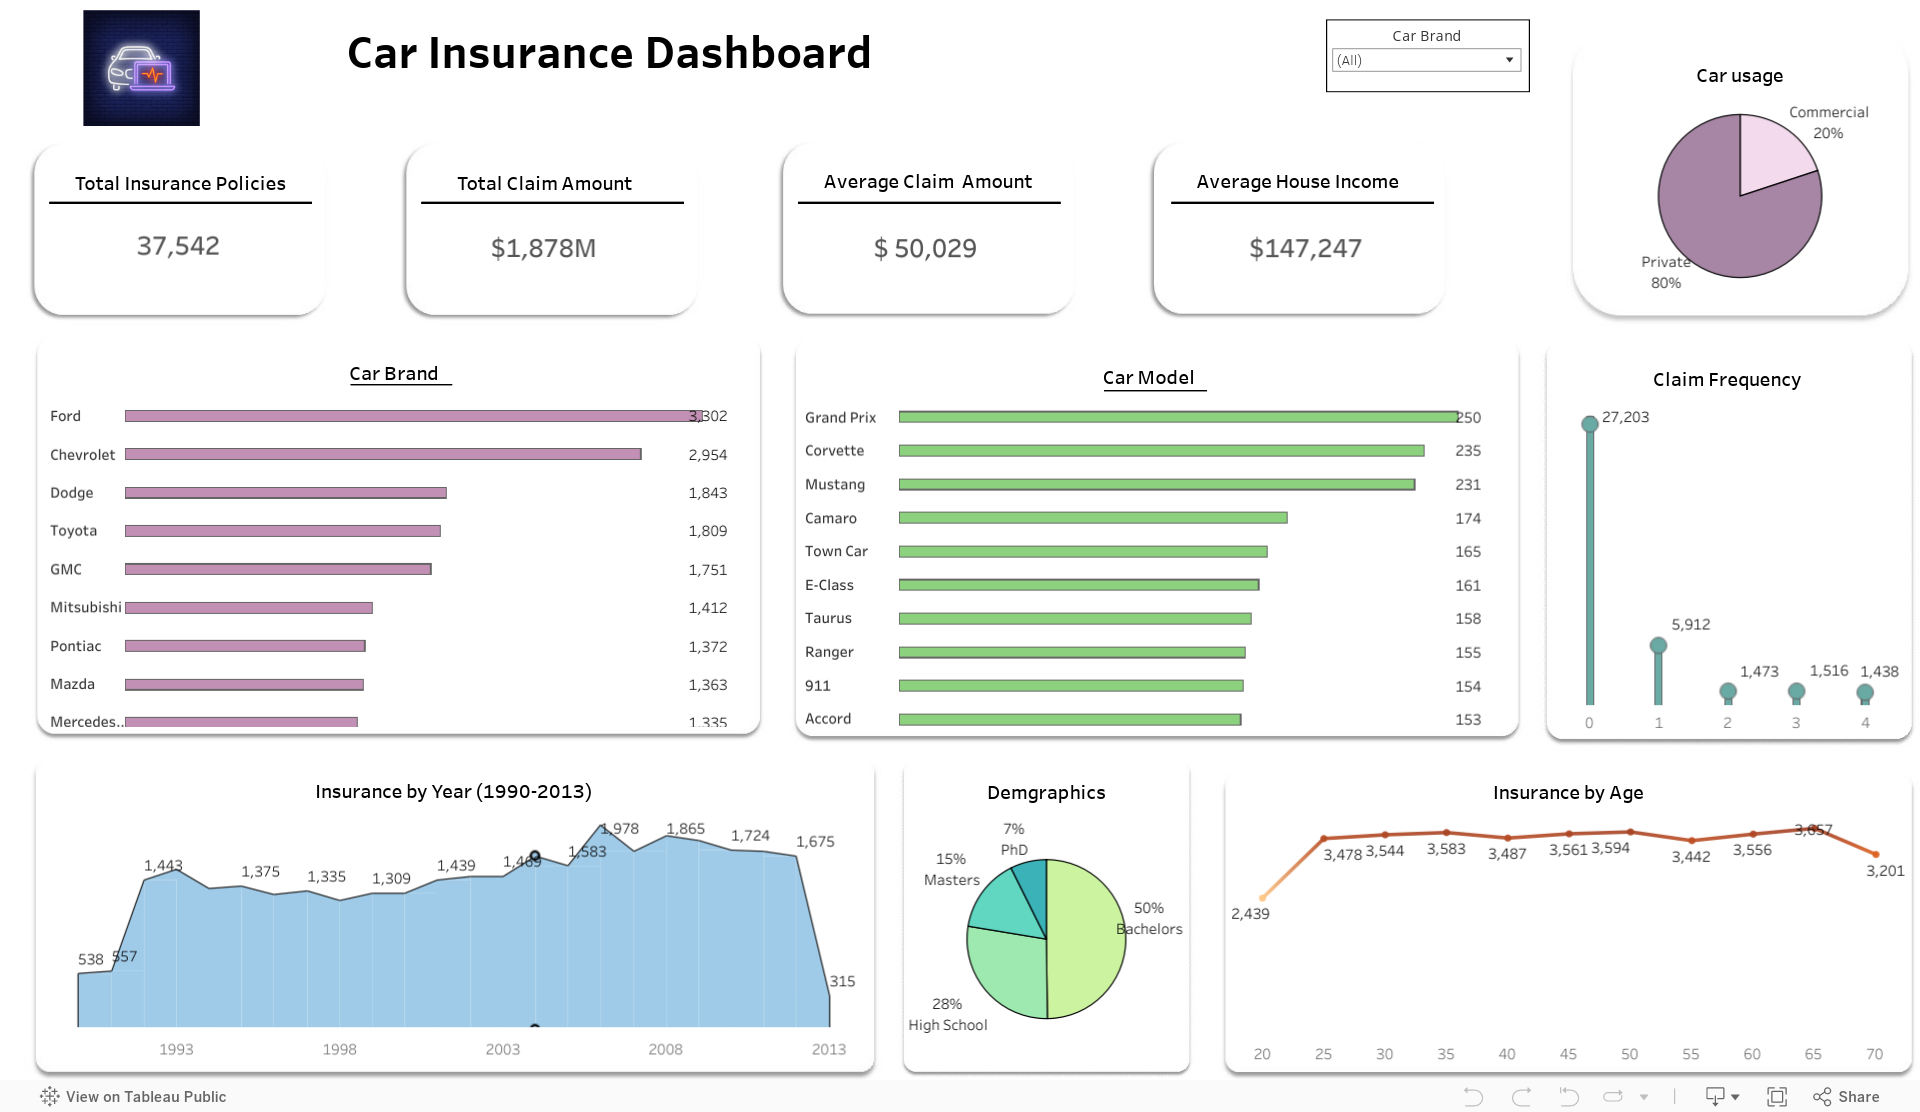
This report presents a comprehensive analysis of a car insurance dataset using Tableau to visualize key performance indicators (KPIs) such as total claim amounts, insurance policies, average claim amount, household income statistics based on various factors, car year breakdown, and claim frequency. The dashboard, equipped with a dynamic brand selection filter, empowers users to customize content instantly, facilitating data-driven decisions and brand-specific comparisons. This Car Insurance Dashboard in Tableau provides stakeholders with a holistic view of the dataset, enabling data-driven decision-making across dimensions like car models, brands, demographics, and usage patterns. By identifying high-risk segments, understanding customer behavior, and refining insurance strategies, this dashboard serves as a potent tool to enhance the efficiency and effectiveness of the insurance business.

Boston, Massachusetts
Chicago, Illinois

Mumbai, Maharashtra

 (708) 697-8566