Revolutionizing Retail Analysis
Take your company to new heights by investing in our reliable and efficient technology solutions.
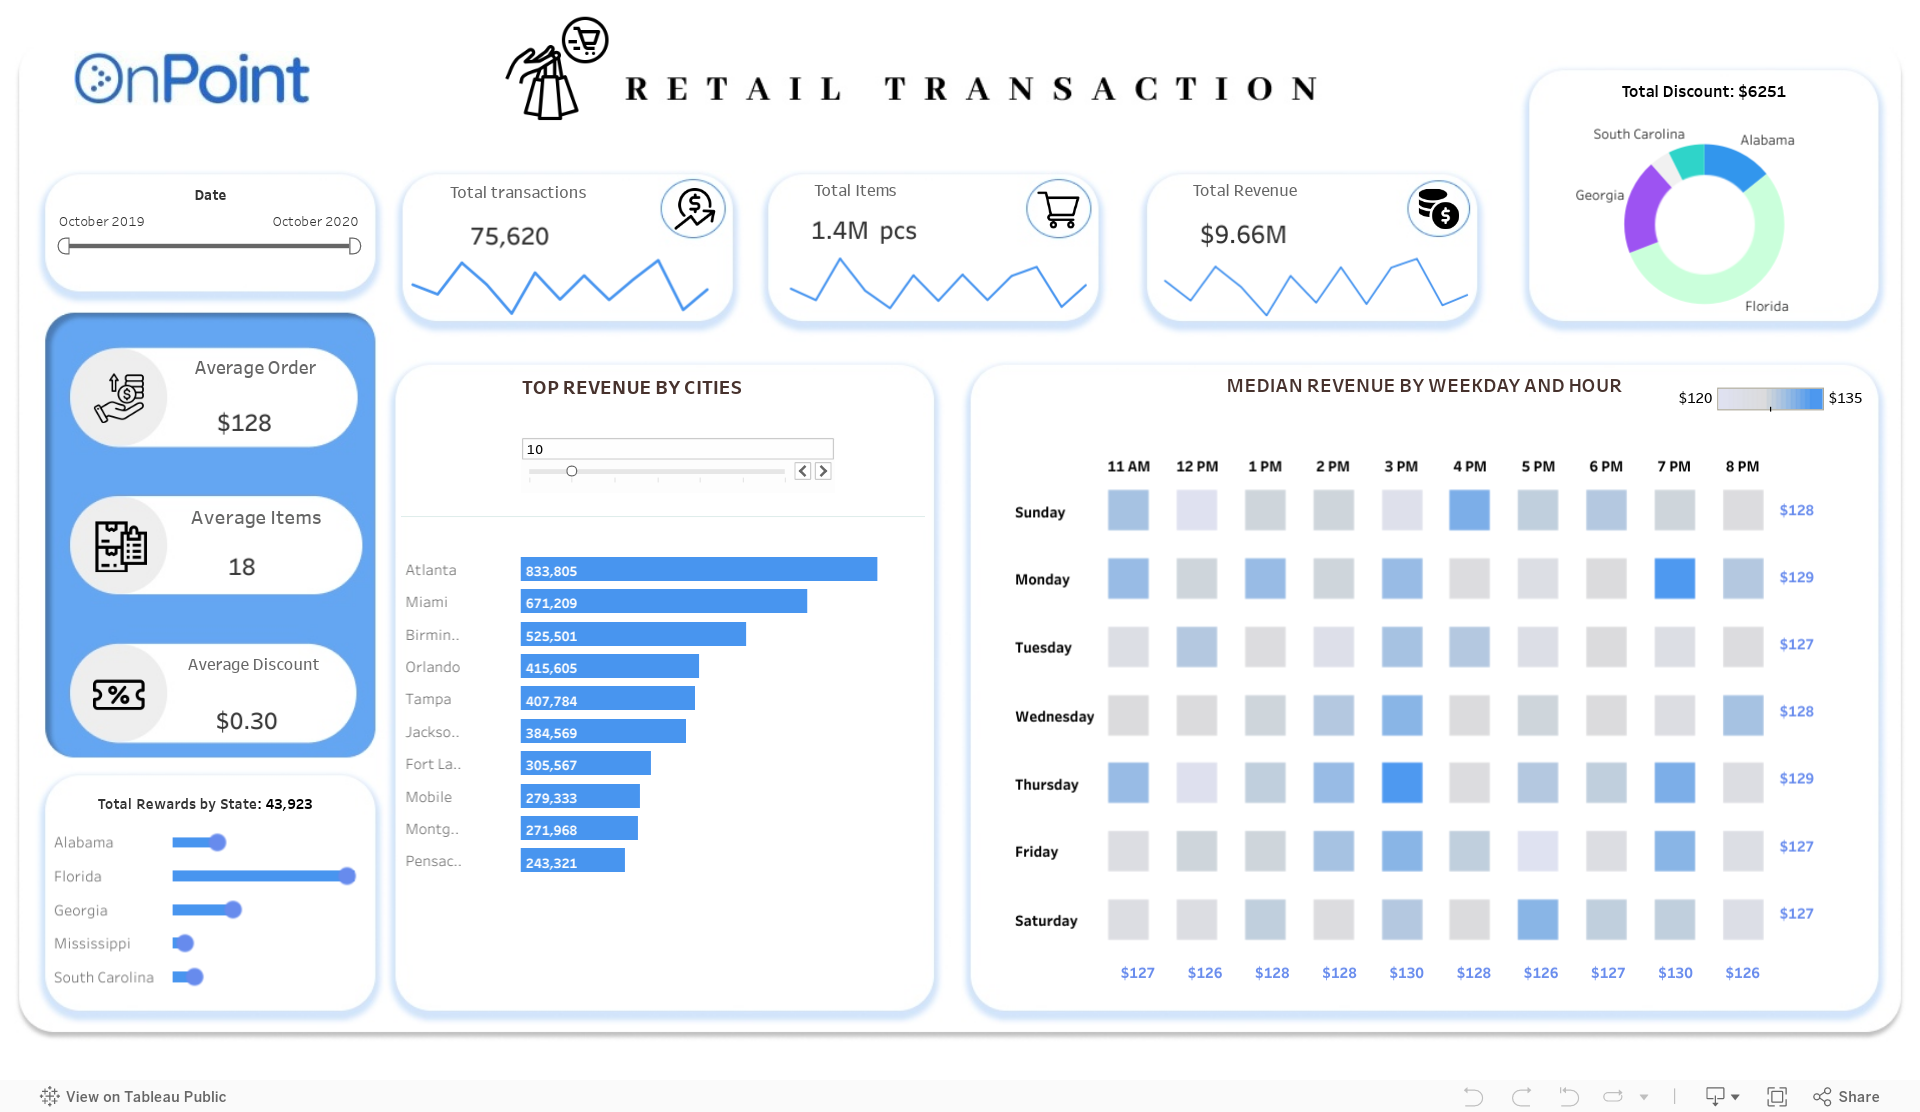
Retail Transaction Insights Dashboard In Tableau: Revolutionizing Retail Analysis
Unlocking Retail Insights: Tableau’s Comprehensive Dashboard for Analyzing Key Performance Indicators, Geographical Trends, and Time-Based Patterns.
The Retail Transaction Dashboard in Tableau is a comprehensive tool designed to analyze our retail operations, providing insights into key performance indicators (KPIs), geographical patterns, and time-based trends. It offers date filters for flexible data exploration, allowing users to customize the analysis period. The dashboard prominently displays critical KPIs, including total transactions, items sold, revenue, average order value, average items per transaction, and average discounts applied. Visualizations such as “Total Discounts and Rewards by US States” reveal regional variations in promotions, while the “Top Cities by Revenue” bar graph aids in city-level strategic planning. Additionally, “Revenue by Weekday” and “Revenue by Hour” charts help identify sales patterns and optimize staffing. Overall, this Tableau dashboard empowers data-driven decisions, operational enhancements, and business growth.