We’re passionate about what we do! Our portfolio is a sheer presentation about 20+ years of industry experience, collaboration, expertise, and quality deliverables.
US-based, 24/7 help desk
System design and networking
Software license management
Hardware procurement and inventory
Cabling and phone systems
On-site systems maintenance
On-site systems maintenance
NIST and CMMC compliant cybersecurity stack
Projects That Speak About Our Versatility
We’re passionate about what we do! Our portfolio is a sheer presentation about 20+ years of industry experience, collaboration, expertise, and quality deliverables.
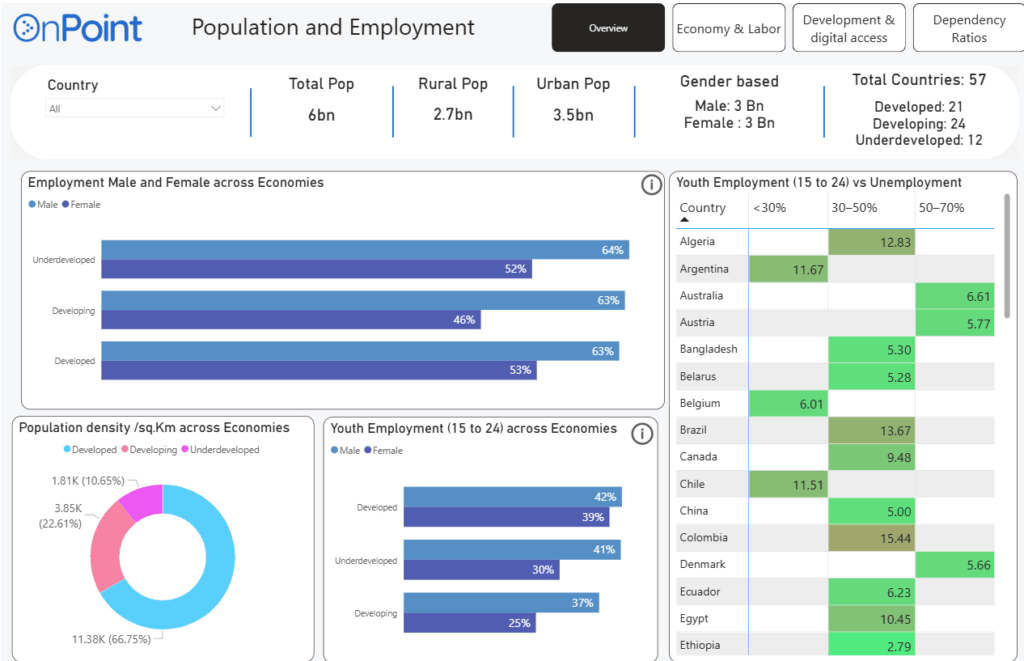
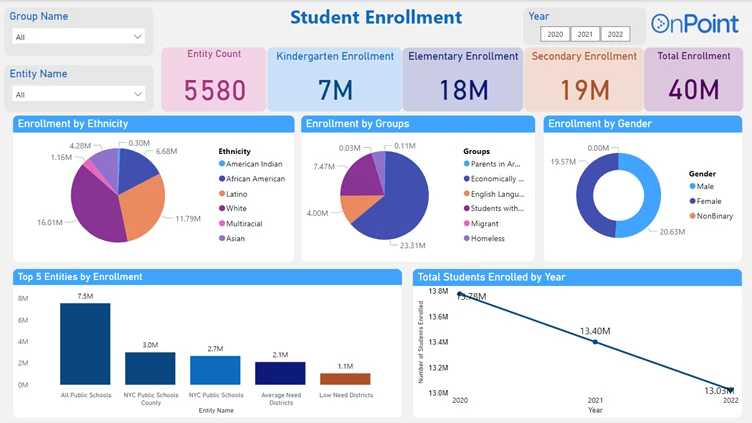
This dashboard offers a comprehensive analysis of global trends with a strong focus on their economic impact. It explores how demographic indicators—such as age distribution, gender balance, and urbanization—shape key economic factors like labor supply, productivity, consumer demand, and fiscal pressure.
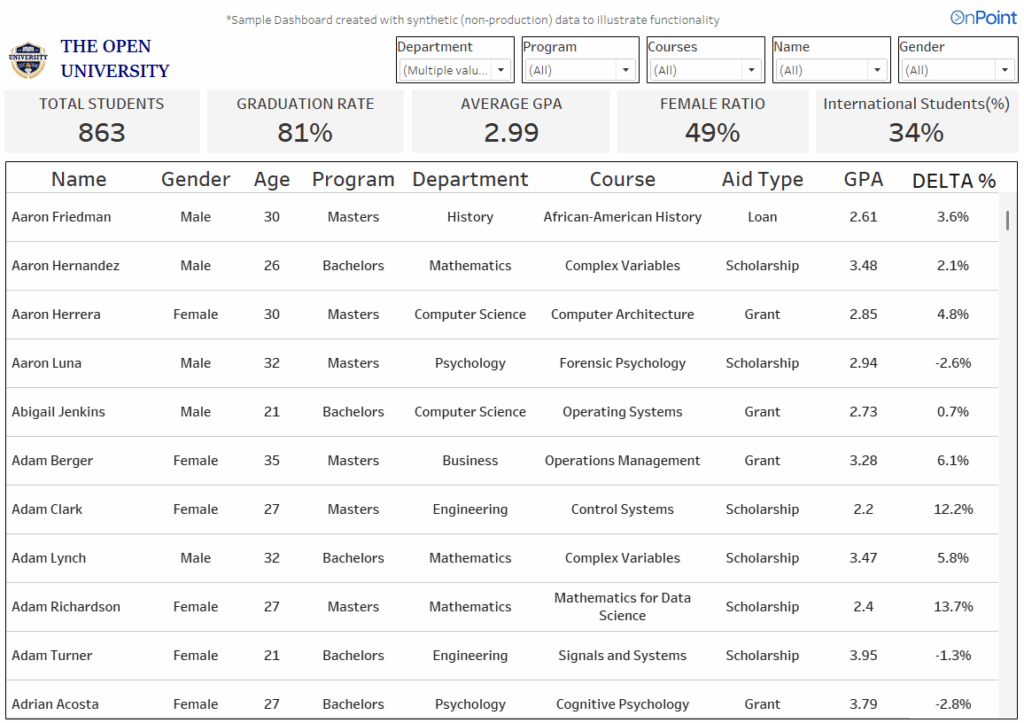
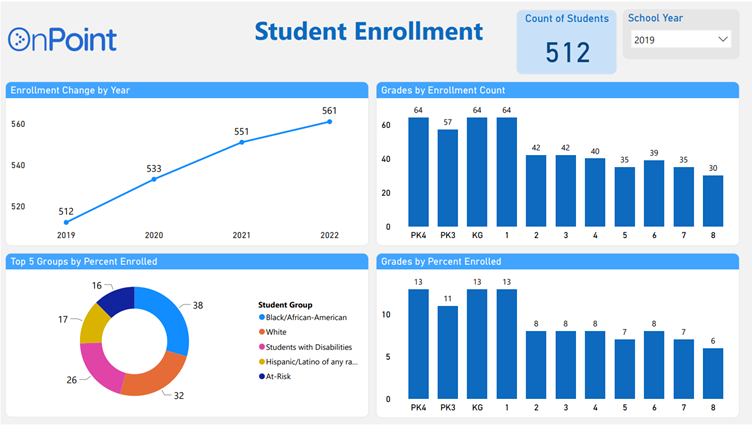
We utilized Tableau Desktop to create an interactive dashboard that visualizes University student’s performances, highlighting key metrics with interactive filters that enable deep, data-driven analysis across different departments, courses and programs.
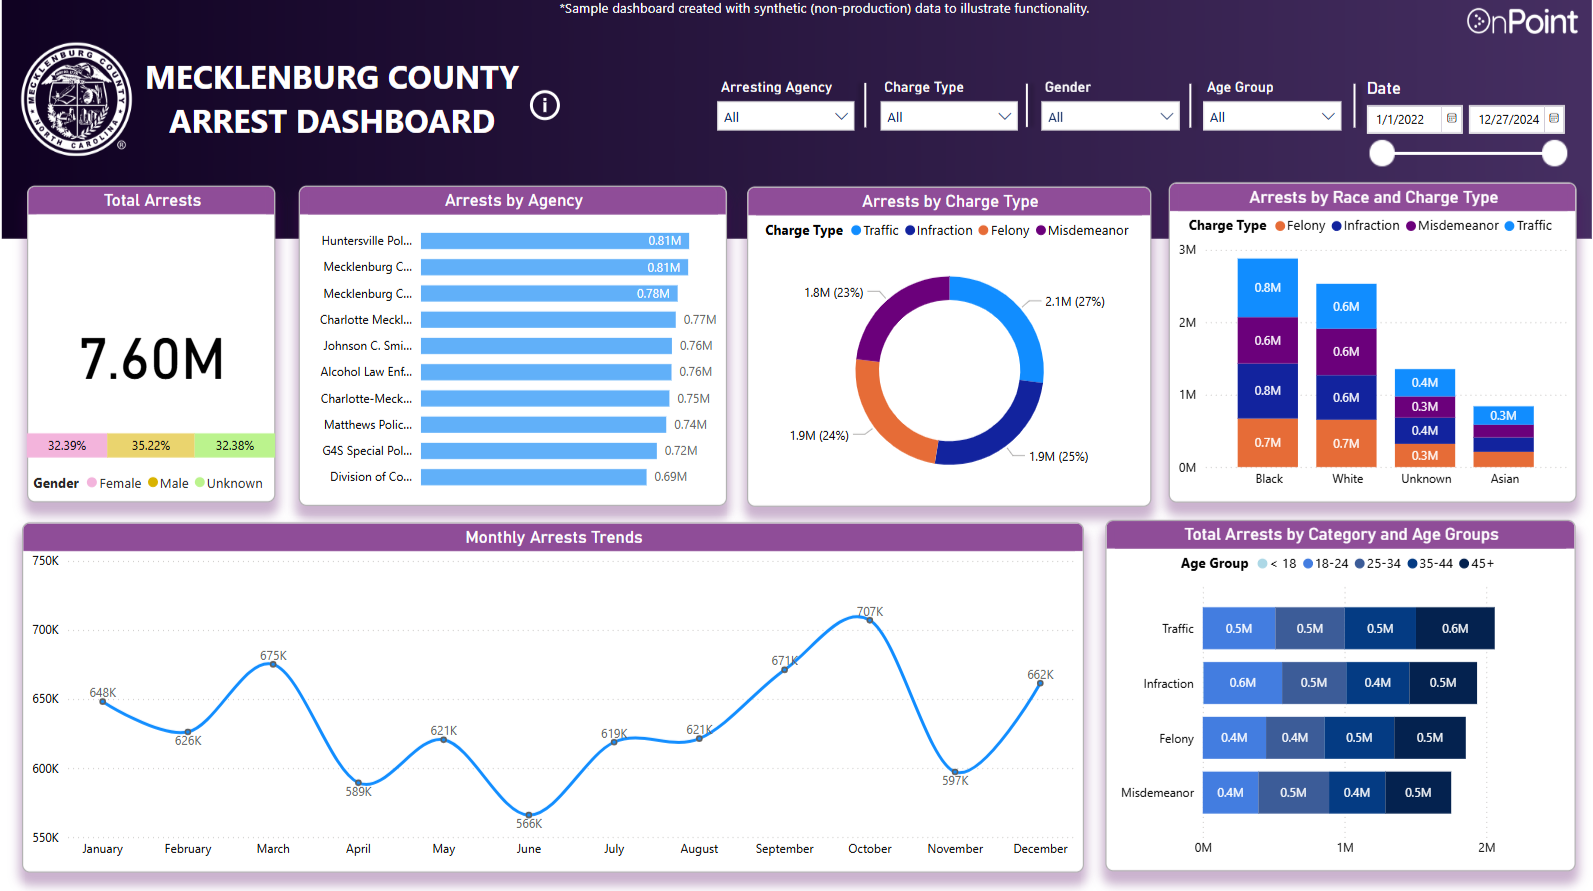
We utilized Power BI to create an interactive dashboard that visualizes County Arrest data, highlighting key metrics with interactive filters that enable deep, data-driven analysis across different agencies, charge types, and trends over time.
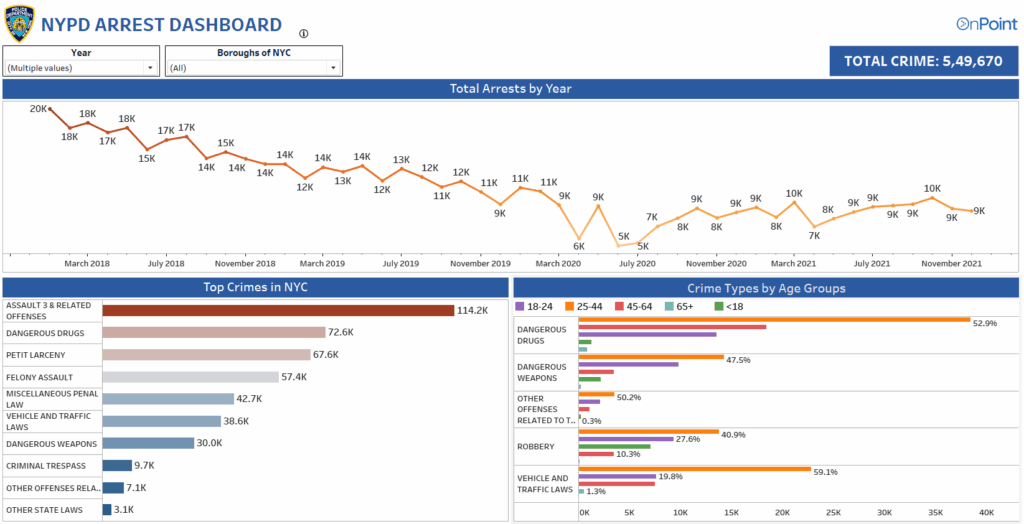
We leveraged Tableau to visualize NYC Arrest and Crime data, highlighting key metric with interactive filters that enable deep, data-driven analysis across boroughs, crime types, and trends over time.
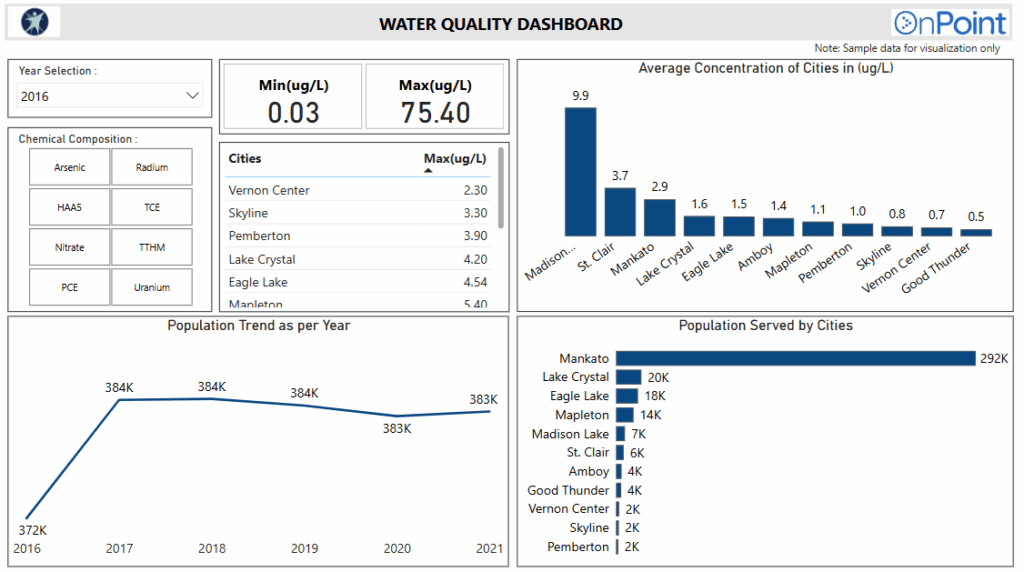
We utilized Power BI to gain insights into urban water quality across various cities, focusing on key metrics such as contaminant concentrations, population served, and historical trends.
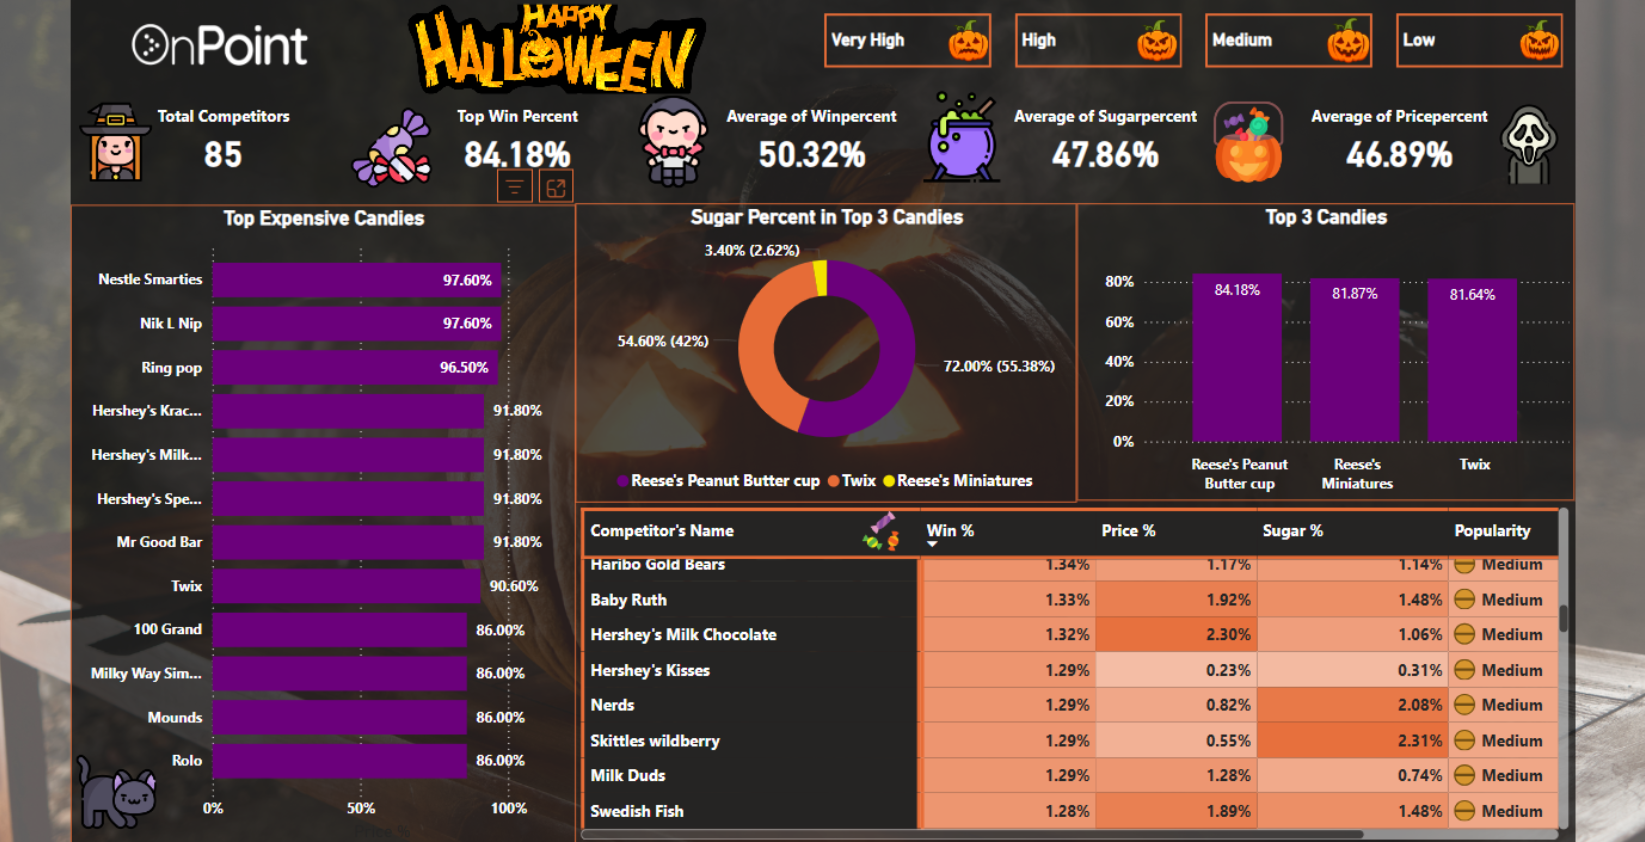
We leveraged Power BI to get insights into the candy market during the Trick-or-Treat season, taking a look at factors such as the costs, sugar content and popularity of top sweetmeats.
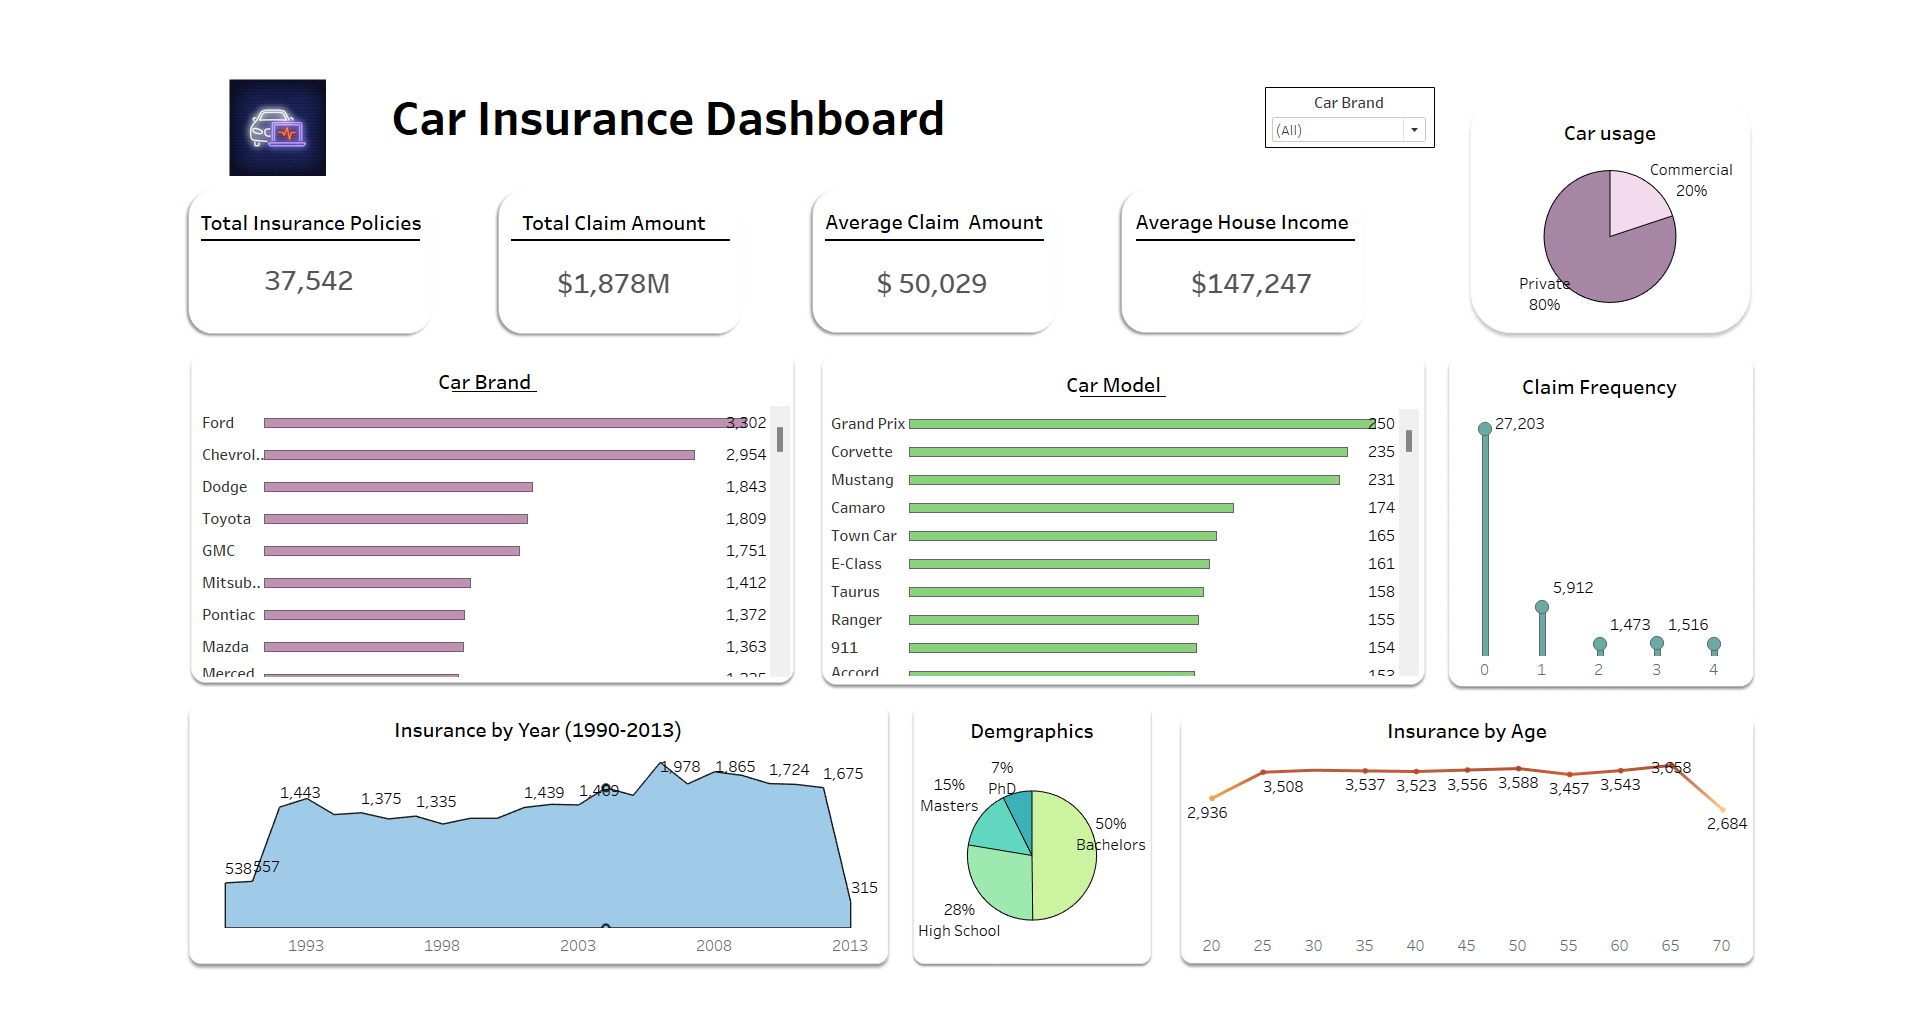
This report utilizes Tableau to analyze a Car Insurance dataset, visualizing key metrics and empowering data-driven decisions with a dynamic brand filter.
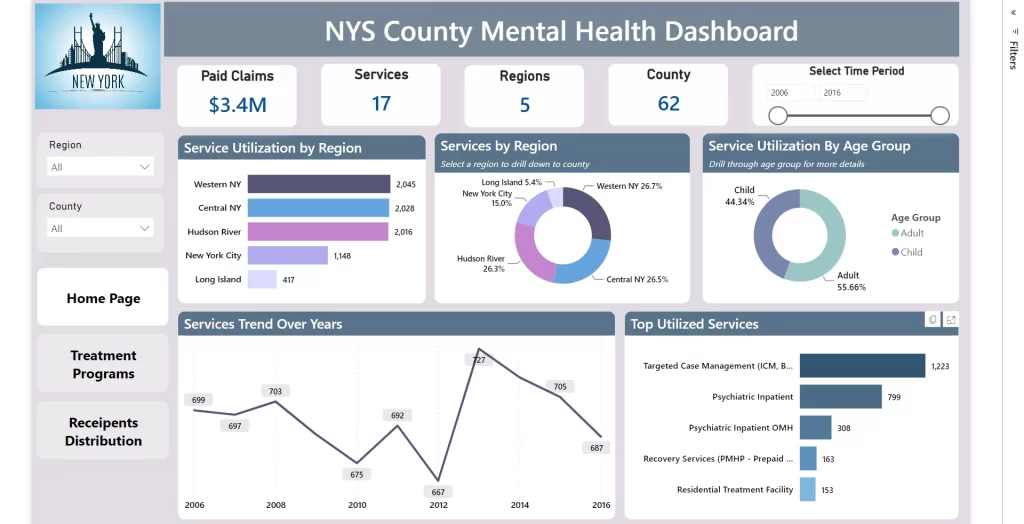
This report provides a detailed analysis of mental health services in New York State counties. This report provides an overview of mental health services, starting with the homepage. The Homepage offers insights.
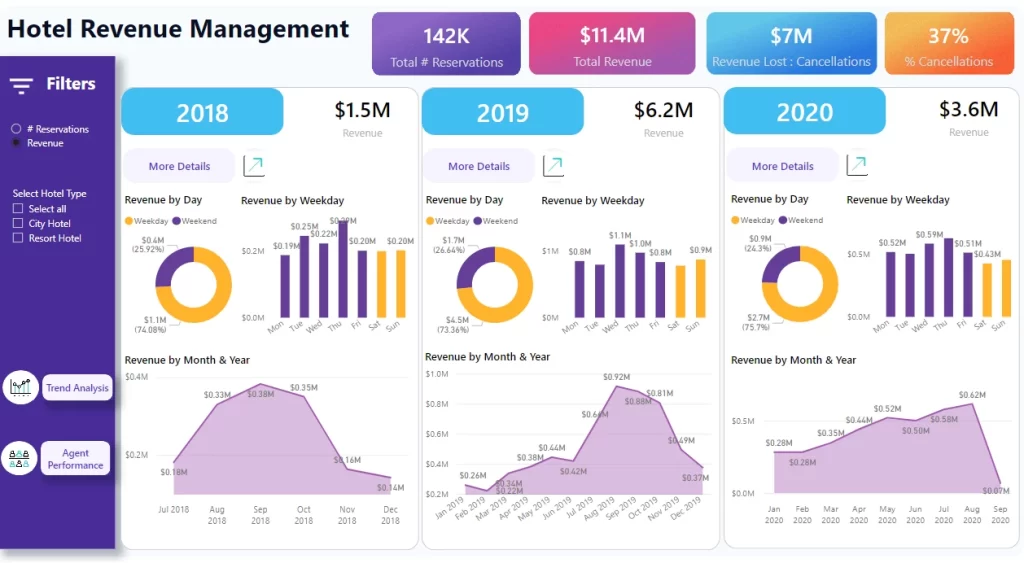
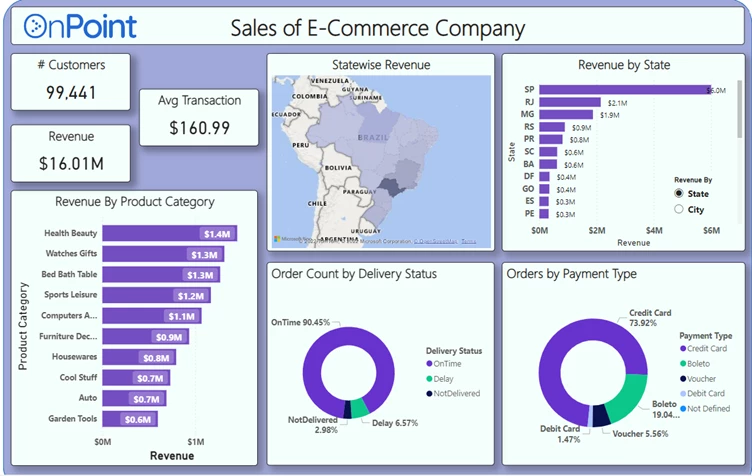
This dashboard showcases the Sales performance of an e-commerce retailer. This dashboards shows sales trends across the geography & product categories.
This report utilizes Tableau to analyze a Car Insurance dataset, visualizing key metrics and empowering data-driven decisions with a dynamic brand filter.
This report provides a detailed analysis of mental health services in New York State counties. This report provides an overview of mental health services, starting with the homepage. The Homepage offers insights.
This dashboard showcases the Sales performance of an e-commerce retailer. This dashboards shows sales trends across the geography & product categories.
Accelerating Insights: Unveiling the Road to Insurance Excellence with Tableau
This report utilizes Tableau to analyze a Car Insurance dataset, visualizing key metrics and empowering data-driven decisions with a dynamic brand filter.