How a PPE Manufacturer Gave Workers Safety Data in Their Own Language
A global manufacturer of personal protective equipment had IoT-enabled gloves generating ergonomic data about how its workers moved. The hard part was the audience: thousands of people across regions, speaking different languages, working from a phone on a shop floor rather than a desk. OnPoint Insights built the pipeline behind the gloves and mobile-first Power BI dashboards that translate into each user’s own language, with row-level security so every worker sees only their own data.
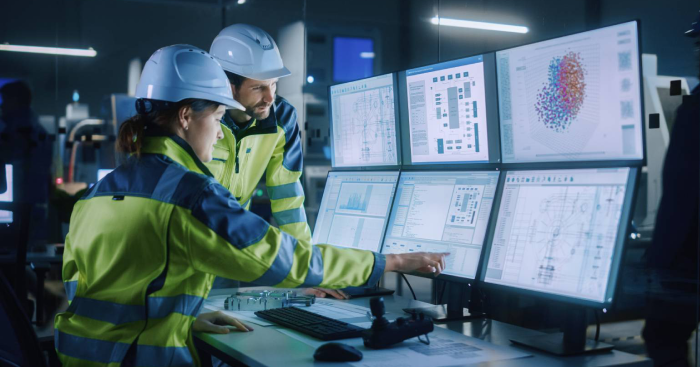
Ergonomic risk, worker by worker
Glove data turned into risk insight each worker can see for themselves, with row-level security so they see only their own.
Dashboards in the reader’s own language
Azure Translator renders the dashboards in users’ native languages, so understanding the insight does not depend on reading English.
Built for a phone, mid-shift
Mobile-first design from Figma wireframes, because the people this is for are not sitting at a desk.
The problem
Safety insight nobody can read is not insight
An ergonomics programme only works if the person doing the lifting can see their own data. That makes this the hardest audience in analytics: thousands of people, several languages, no desk, no BI training, and an entirely reasonable wariness of anything that measures how they work.
Our client had the data coming off the gloves. What they needed was a way to collect and clean it from multiple sources, present it on a phone, in the right language, and guarantee that each person’s movement data stayed their own.
What was getting in the way
- Complex data from multiple sources had to be collected and cleansed before it could support reliable analytics.
- The dashboards had to be intuitive and responsive on mobile devices, for shop floor use rather than desk use.
- Users across different regions and roles needed the dashboards in their own languages.
- Sensitive, user-specific data had to be protected so that each person could only see what was relevant to them.
Our approach
Design for the shop floor first
What we found
The modelling was not the difficult part. The difficulty was that this dashboard had to work for someone holding a phone, mid-shift, reading in their second language or not in English at all. Every design decision followed from that constraint rather than from what the data could theoretically show.
What we did
Agreed what the data could honestly tell them. Stakeholder workshops to understand the ergonomic risk data and which insights it could genuinely support, before anything was built.
A pipeline that produced analysis-ready data. End-to-end ingestion into Azure Data Lake Storage, with cleansing and transformation into BI-ready form, developed iteratively.
Mobile-first dashboards, designed before built. A data model and Power BI dashboards built from approved Figma wireframes, for phone screens in a working environment.
Translated as the user opens them. Azure Translator with Power BI external tools renders each dashboard in the user’s own language, in real time rather than as separate localised versions to maintain.
The choice we made
We treated row-level security as a design principle rather than a compliance checkbox. Each worker sees their own ergonomic data and nobody else’s. Wearable data about how a person moves is personal, and a safety programme that shows one worker another worker’s numbers stops being a safety programme and becomes a monitoring one. Adoption goes with it, and on the shop floor adoption is the only thing that matters.
-
 Azure Data Factory
-
 Power BI
-
 Microsoft Azure
-
 Azure Machine Learning
-
 Azure Data Lake Storage
-
 Figma
-
 Android
-
 React
-
 Java
The results
What changed on the floor
Ergonomic risk became something a worker could see and act on, rather than something reported about them.
Risks get addressed, not recorded
Ergonomic risks surface while something can still be done about them, which turns an ergonomics programme from an annual assessment into a daily one.
Workers actually used it
Mobile-first design and native-language dashboards led to broad internal adoption, which for a shop floor tool is the result everything else depends on.
Less fatigue, by their own hand
Workers could see their own movement patterns and adjust them, which reduced fatigue. The improvement belongs to the person who made it, which is why it stuck.
Facing a similar challenge?
Talk to our data and AI team about where you are today and what good looks like. 30 minutes, no obligation.
Book a consultation
More Case Studies
Next Case Study

How a Biotech Leader Automated Project Tracking in a Regulated Environment