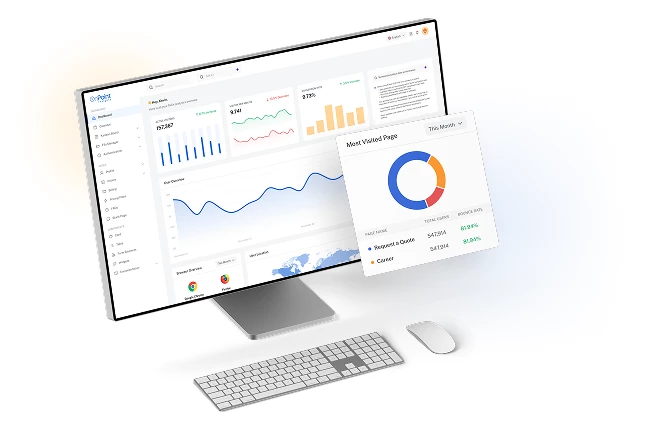
Visualization Built for Impact
Transform raw data into intuitive dashboards that empower every role in your organization.
We design interactive dashboards that translate complex datasets into clear, meaningful insights for leadership and operational teams.
We consolidate metrics across systems into a single, consistent reporting layer that aligns teams around trusted KPIs.
Our solutions provide live performance tracking so leaders can act faster and respond proactively to change.
We integrate predictive analytics and intelligent alerts into dashboards to move beyond reporting and toward foresight.
Data Visualization Services
Helping organizations deliver clarity, alignment, and measurable impact through modern BI solutions.


Role-based dashboards designed for leadership with clear KPIs and strategic performance tracking.
Real time insights across sales, operations, finance, and supply chain for improved day to day decision making.
Develop governed semantic models to ensure consistency in metrics across departments and regions.
Enable business users with intuitive tools that reduce dependency on technical teams.
Deliver insights directly into applications and mobile environments for on the go access.
Improve dashboard performance, refresh cycles, and usability to ensure fast and reliable reporting.
Work That Delivers Impact
Real world implementations where our visualization frameworks improved reporting speed, enhanced KPI alignment, and enabled faster executive decisions.

Enhancing Financial Insights for a Leading Philanthropic Fund

Enhancing Legal Data Insights for Smarter Judiciary Decisions

Empowering Sustainability through Carbon Emission Analytics
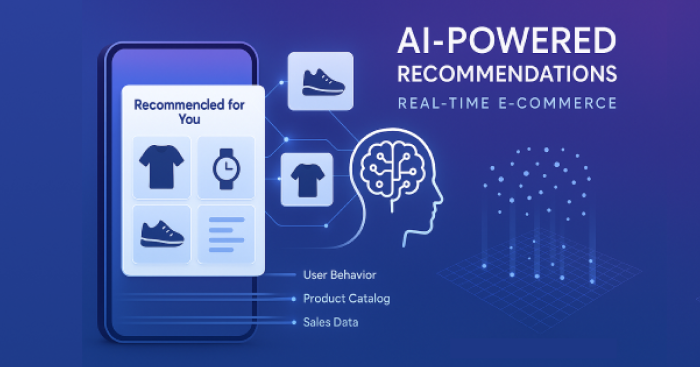
AI-Powered Product Recommendations for E-Commerce

Improving Preventive Healthcare with Smarter Diagnostic Dashboards
Transform Your Data Into a Business Asset
Book a consultation and take the first step toward smarter, data-driven decisions
Book Now
Our Way of Working
Designing visualization ecosystems that are scalable, governed, and aligned with business priorities.
Solutions Across Industries
Solving complex data and operational challenges across industries.


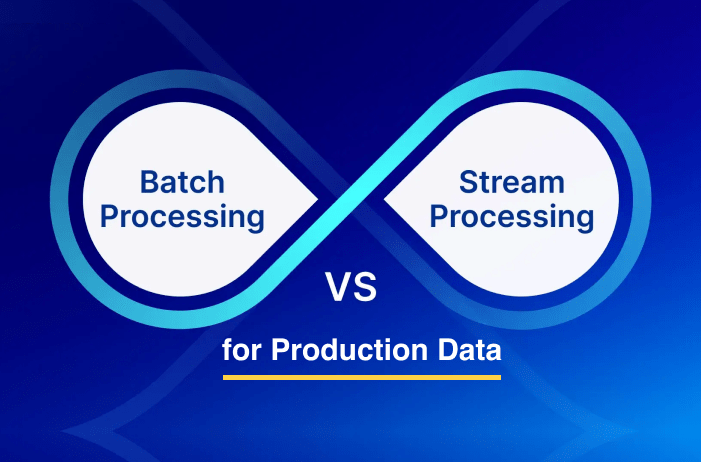
Real-Time vs. Batch Processing for Production Data: Choosing the Right Approach
Read More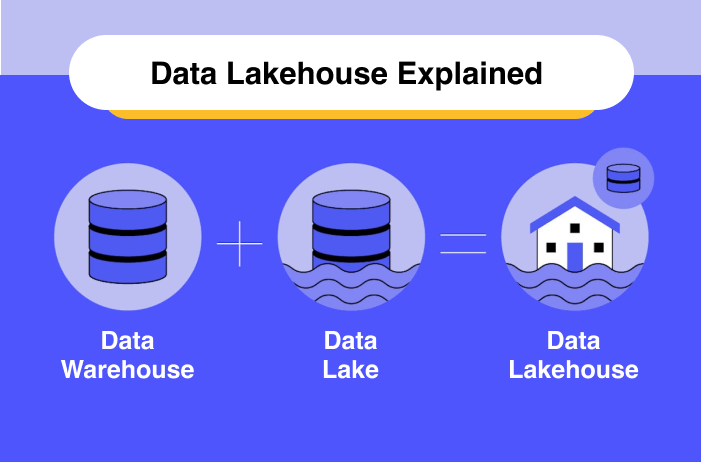
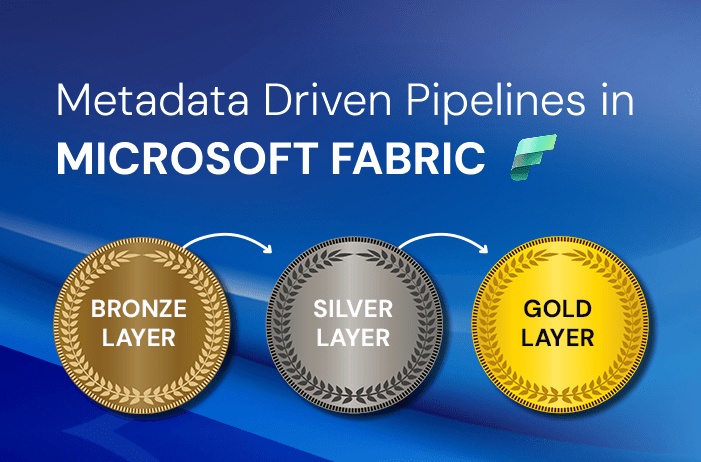
Data Lakehouse Explained: Building a Modern and Scalable Data Architecture
Read More
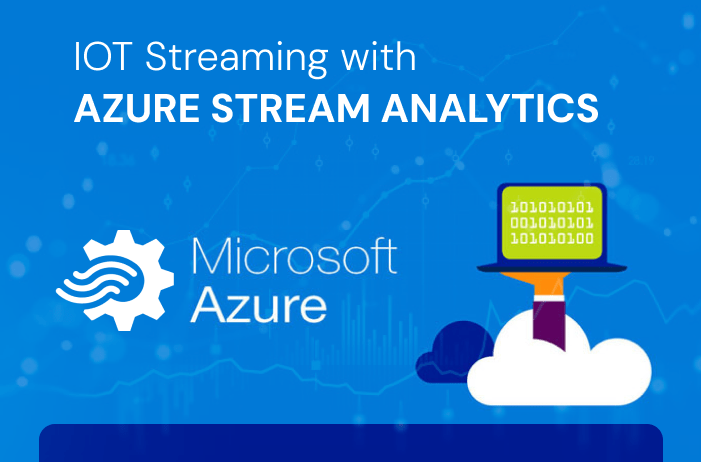
From Device to Dashboard: IoT Streaming with Azure Stream Analytics
Read More
Leveraging Snowflake and Snowpark for Seamless API Data Ingestion
Read More
Facing Issues with Dates in Tableau? Here’s Why a Separate Date Table Solves It
Read More
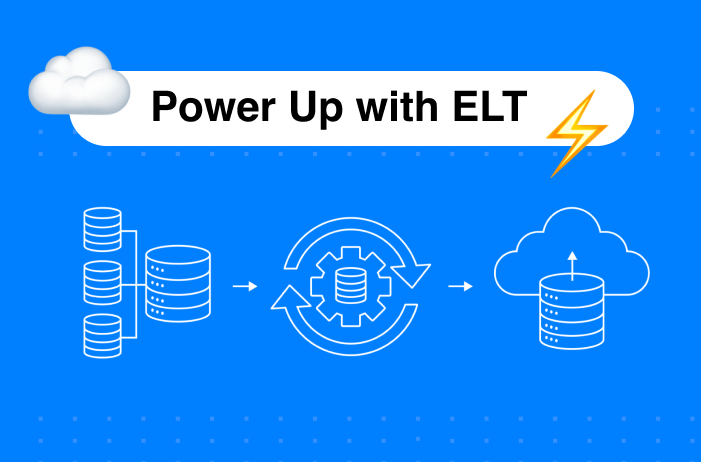
Unleashing the Power of ELT: Architecting a Fivetran-Snowflake-dbt Data Pipeline
Read More
Questions You May Have
Clarifying how we work, what to expect, and how we deliver value.
We build solutions using enterprise grade BI platforms such as Power BI and other modern visualization tools tailored to your ecosystem.
We implement governed semantic models and standardized definitions across dashboards to maintain alignment.
Yes. We embed AI driven forecasting, anomaly detection, and intelligent alerts within dashboards.
Absolutely. Our architecture supports enterprise wide deployment with role based access controls.
We optimize data models, streamline queries, and improve refresh strategies to ensure speed and reliability.
Related Services
Next ServiceCollaborate with us
We're here to answer your questions and help you find the right solution.


"*" indicates required fields