How an Industrial Manufacturer Moved From Reactive to Predictive Maintenance
An industrial manufacturer was already collecting machine-level sensor data across its facilities, and it was arriving faster than anything could process it. Faults were found when a machine stopped, not while it was still a maintenance job. OnPoint Insights built a path from the sensors through Azure Stream Analytics and a central data lake into Power BI, so equipment condition is visible as it happens and maintenance is scheduled on evidence.
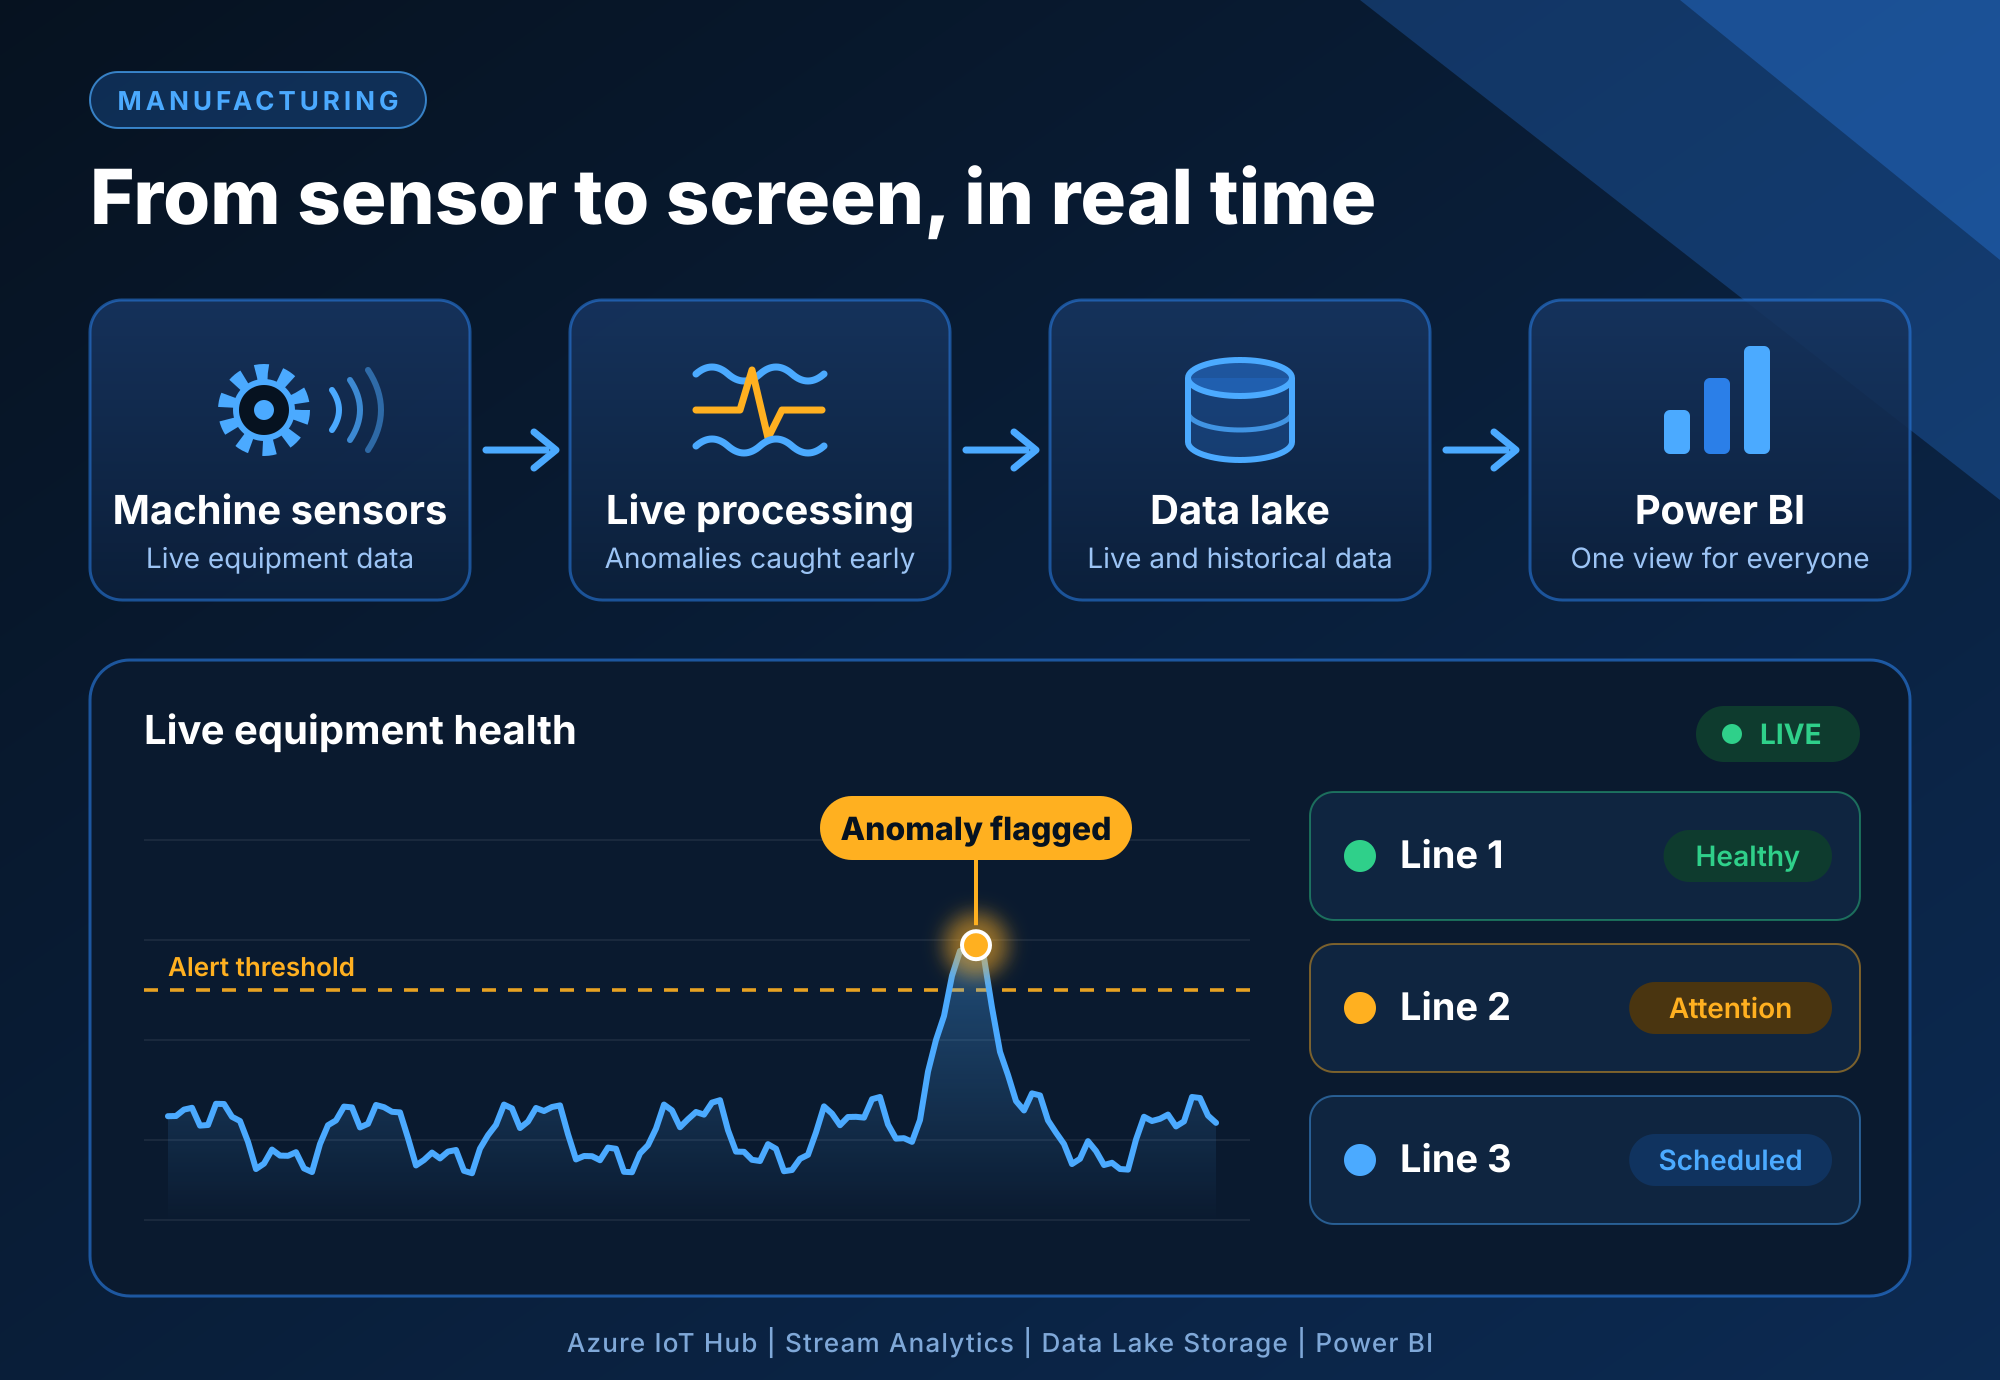
Machine data to live dashboard
Sensor data streams through Azure Stream Analytics into Power BI, so equipment status is current rather than reported after the shift.
Anomalies flagged as they happen
Real-time anomaly detection replaces finding out about a fault when the machine has already stopped.
Reactive to predictive maintenance
Live and historical data together inform maintenance schedules, so components get attention before they fail.
The problem
The sensors were already talking. Nobody was listening in time
Unplanned downtime costs more than the lost output. There is the overtime to recover the schedule, and there is the damage a failing machine does to itself between the first symptom and the stop. Most of those symptoms are already in the sensor data. The problem is that nobody sees them until afterwards.
Our client’s facilities generated high volumes of IoT sensor data with no centralised way to process it, so there were no real-time alerts and no reliable history to learn from. Maintenance was scheduled around failures rather than ahead of them.
What was getting in the way
- High volumes of IoT sensor data with no centralised system to process and analyse it effectively.
- No real-time anomaly alerts, so equipment issues were detected late, increasing the risk of unplanned downtime and equipment damage.
- Maintenance was reactive, with no way to move to a predictive approach.
- Operational complexity and inconsistent data quality made reliable insight difficult, and teams had little visibility into equipment performance or historical production trends.
Our approach
One path from the sensor to the screen
What we found
The data was never the missing piece. It was arriving faster than anything could process it, which in practice is the same as not having it. The work was in building a path that handles the stream in real time and keeps it for the long view.
What we did
Real-time processing at the front. Azure Stream Analytics processes sensor data as it arrives, so an anomaly is detected immediately rather than discovered in a report.
One store for now and for history. An Azure Data Lake holds both the live stream and the historical record, which is what makes trend identification and prediction possible at all.
Dashboards for the floor and the board. Power BI shows live equipment status and facility health, so an operator and a director are working from the same picture.
Quality and cost managed by design. Validation, monitoring and scaling strategies keep the data reliable and Azure consumption in proportion to what it delivers.
The choice we made
We kept the historical data in the same lake as the live stream, rather than treating real-time monitoring as a system of its own. Streaming alone tells you a machine is behaving oddly right now. It takes the history to know that this same pattern preceded the last three failures. Predictive maintenance only works when both live in one place.
-
 Azure IoT Hub
-
 Azure Stream Analytics
-
 Azure Data Lake Storage
-
 Power BI
-
 Microsoft Azure
The results
What changed on the floor
The operations team stopped reacting to stoppages and started preventing them.
Faults surface before the stop
Real-time anomaly alerts mean a developing problem is visible while it is still a maintenance job, which is where the downtime and the equipment damage are avoided.
Maintenance scheduled on evidence
Live and historical data inform when a machine is serviced, so the team works to the condition of the equipment rather than to the calendar or to the last breakdown.
One view across facilities
Centralised dashboards show equipment status and production performance together, so comparing one facility against another is a glance rather than an exercise in collating reports.
Facing a similar challenge?
Talk to our data and AI team about where you are today and what good looks like. 30 minutes, no obligation.
Book a consultation
More Case Studies
Next Case Study
How a Database Audit Fixed a Healthcare Platform Serving 400+ Cities
How a Wearables Innovator Predicted Slips Before They Happened