How a Global Staffing Firm Unified Learner Progress Across Multiple LMS Platforms
A global staffing and talent solutions firm prepares specialists for client placements through structured learning and runs a different learning management system in each of its regions. Every system produced its own standard reports, nobody could see across them, and the only way to compare was to merge the exports by hand. OnPoint Insights built custom connectors into each platform, combined them into one model, banded every learner by engagement, and put the result inside the SharePoint portal that hiring managers and clients already use.
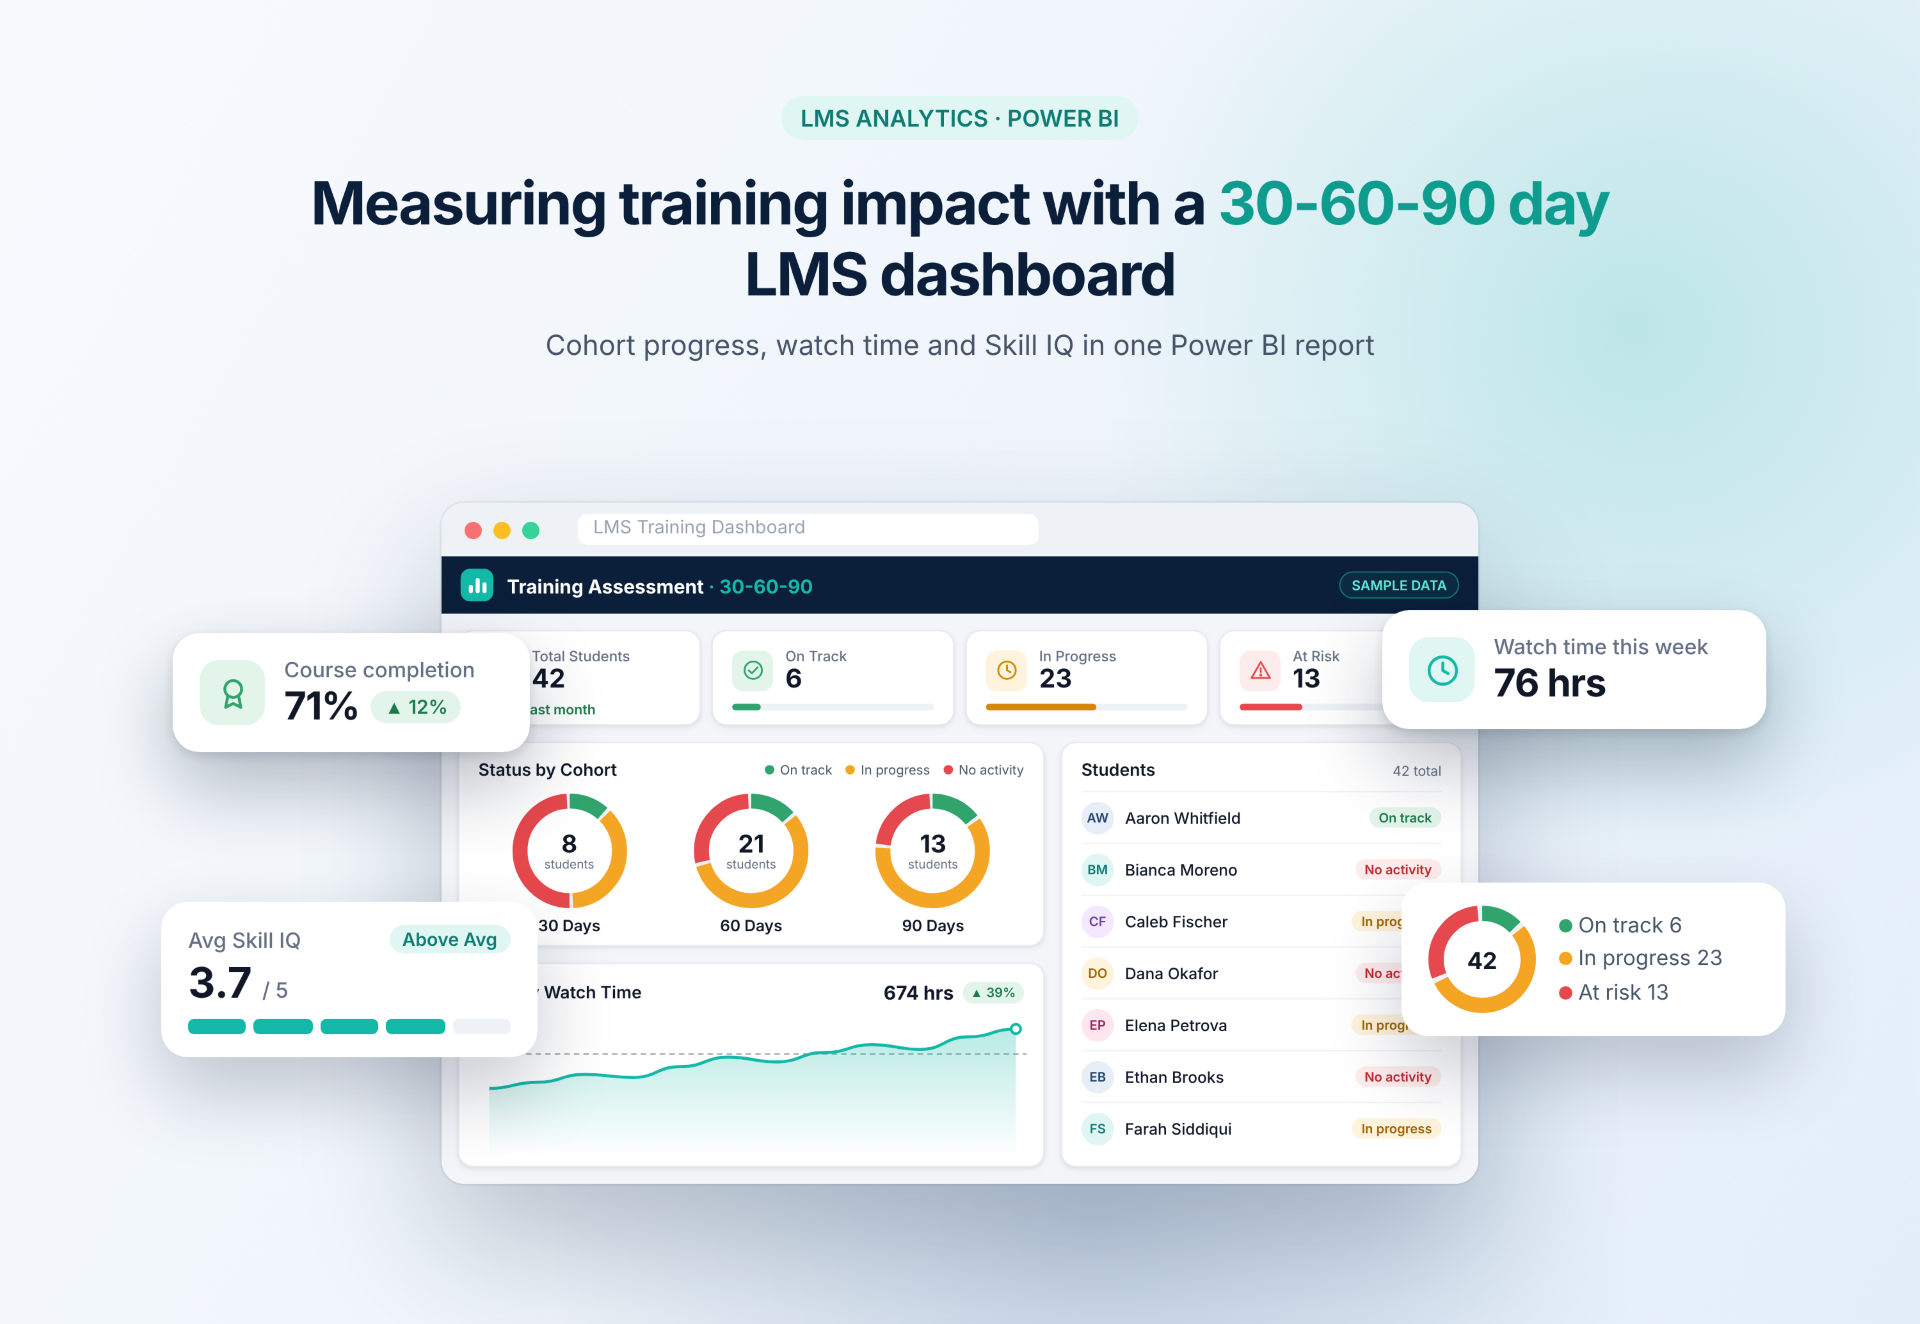
One view, every LMS
Learner data from the separate regional platforms, integrated automatically into a single dashboard.
Red, yellow, green
Every learner banded automatically on 90-day engagement metrics.
Shared in SharePoint
Dashboards embedded in the portal hiring managers and clients already use.
The problem
Learning data in every region, and no view across any of it
For a staffing business, readiness is the product. A specialist’s skills are what gets placed, what the client is paying for, and what the next engagement depends on. So the question that matters most, whether a given person is actually ready, is also the one that is hardest to answer when the training records sit in a different system in every region.
Each learning platform produced its own standard management reports, which described that platform and nothing beyond it. Building any view across them meant exporting, merging and transforming by hand, and the API behind the data capped how much could be pulled at a time. The result was a picture that was always partial and always out of date.
What was getting in the way
- Several learning management systems across different offices, each producing only its own standard reports.
- Combining them meant manual integration and transformation, which was slow and prone to error.
- The GraphQL API limited how much data could be retrieved in a single request, so no complete dataset could be assembled.
- There were no clear per-learner metrics, so nobody could distinguish a specialist who was progressing from one who had stalled.
- Learning could not be compared between time periods, so there was no way to see whether engagement was improving.
Our approach
Get all the data out, agree what progress means, then put it where people work
What we found
The API limit was the first wall and the obvious one. The harder problem was that each platform described learning in its own terms, so the work was less about retrieving data than about agreeing what progress meant across all of them before anything could be compared.
What we did
Custom connectors, built to get past the limit. Custom Power Query M queries and connectors pull learner data from each platform through its GraphQL API, working around the per-request cap so the full dataset reaches Power BI.
One model that absorbs the next platform. . A flexible data model combines the learning systems with SharePoint and is built so another platform can be added later without rebuilding it.
Learners banded automatically. A rule set scores minutes of content consumed, modules completed and certificates earned across a 90-day window, and bands each learner red, yellow or green. It was tuned repeatedly against real data rather than set once.
Delivered where people already work. Dashboards embedded in the SharePoint portal that hiring managers and clients already use, with learner records held in SharePoint lists and period-on-period comparison built in.
The choice we made
We chose to build the dashboards directly into the SharePoint portal the business already used every day, rather than delivering them through a separate Power BI workspace. It was the more demanding build, and the one that made the reporting part of people’s daily work: hiring managers and client teams see learner progress in the system they already have open, with no second tool to log into.
-
 Power BI
-
 GraphQL
The results
What changed for the business
Learner progress stopped being something the business compiled and became something it could look at.
Learner status at a glance
The red, yellow and green bands over a rolling 90-day window mean a hiring manager sees where a specialist stands without reading a report, and can compare one period against another.
Manual consolidation gone
Automated integration and custom connectors replaced the exporting and merging of reports from each platform, removing both the delay and the transcription errors that came with it.
Focus areas, person by person
Per-learner metrics show where each specialist needs development, so training is targeted at the individual rather than issued to everyone and hoped for.
Facing a similar challenge?
Talk to our data and AI team about where you are today and what good looks like. 30 minutes, no obligation.
Book a consultation
More Case Studies
Next Case Study
How a Preventive Healthcare Provider Turned Diagnostic Data into Early Warnings
How an HVACR Retailer Rebuilt Product Recommendations with Machine Learning