
From Device to Dashboard: IoT Streaming with Azure Stream Analytics
Table of Contents
Introduction
The Internet of Things (IoT) refers to a network of devices, vehicles and other physical objects that are embedded with sensors, software and network connectivity, allowing them to collect and share data.
The IoT touches many aspects of our lives. From wearables and connected appliances to cars, factories and retail stores, more and more devices constantly churn out data that gets collected somewhere.
According to Statista, they estimate the total number of IoT connections worldwide would reach sheer 31 billion.
That means we have to collect, process, and analyze orders of magnitude more data than ever before. As sensors and devices become ever more prevalent in our life; trend in data is only going to increase.
Today’s device driven world is forcing analytics to occur as fast as the data is generated which is core of IoT analytics – which is based on event stream processing.
IoT streaming means continuous, real-time flow of data from Internet of Things (IoT) devices to a central system of processing and analysis.
There are almost all of the major cloud providers offering services to process real time data. Following is some of them:
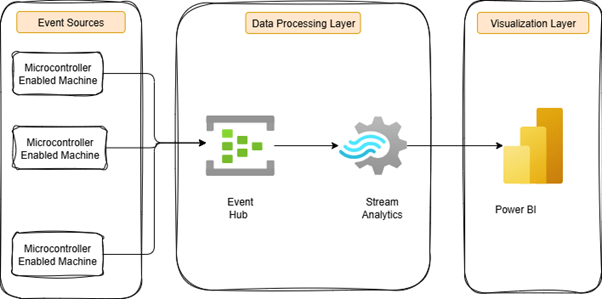
The diagram above illustrates the end-to-end IoT streaming pipeline from devices to dashboard. At the event source layer, microcontroller-enabled machines continuously generate data like temperature, pressure, and blower speed, etc. These events flow into Azure Event Hub, a highly scalable data ingestion service that handles millions of events per second.
The data then moves to the data processing layer, where Azure Stream Analytics uses simple SQL-like queries to perform real-time filtering, aggregation, and anomaly detection. This transforms raw, noisy data into meaningful, actionable insights.
In the final visualization layer, the processed data appears in Power BI dashboards. Decision-makers can monitor these interactive displays in real time, track KPIs, and receive immediate alerts when anomalies occur. This seamless flow from device to dashboard enables organizations to respond instantly to critical situations and maximize the value of their IoT investments.
Key Capabilities of Azure Stream Analytics
1. Fully Managed & Serverless
No need to worry about infrastructure, updates, or maintenance—Azure Stream Analytics is fully managed. You can focus entirely on your data and business outcomes.
2. Simple, SQL-Based Query Language
If you know SQL, you’ll feel at home. Stream Analytics uses a familiar query language with added support for time-based data, geospatial functions, and anomaly detection. It can even be extended with JavaScript, C#, or integrated with Machine Learning models.
3. Seamless Azure Integration
It connects easily with Azure services like Event Hubs, IoT Hub, Blob Storage, Cosmos DB, and Power BI—helping you build end-to-end streaming pipelines effortlessly.
4. Runs in the Cloud or at the Edge
You can run your analytics in the Azure cloud or directly on IoT devices and edge gateways. This flexibility ensures insights can be generated where they matter most.
5. High Performance at Scale
Built on the powerful Trill engine, Stream Analytics can process millions of events per second with ultra-low latency, making it ideal for real-time scenarios.
Benefits of Azure Stream Analytics
Conclusion
Ready to Unlock the Power of Real-Time IoT Analytics? click here.
Contact OnPoint Insights today and see how we can help you leverage Azure Stream Analytics, Power BI, and advanced data pipelines to build smarter dashboards, optimize decision-making, and drive business value.
For more insights, explore the OnPoint Insights Blog, where we share practical tips on analytics, BI, data strategy, AI & ML, and more.
References
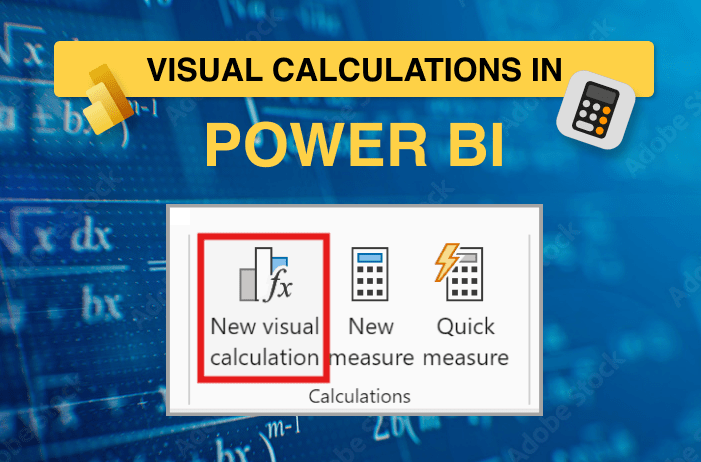
- Using visual calculations for conditional formatting – https://www.sqlbi.com/articles/using-visual-calculations-for-conditional-formatting/
- Microsoft documentation – https://learn.microsoft.com/en-us/azure/stream-analytics/stream-analytics-introduction
Collaborate with us
We're here to answer your questions and help you find the right solution.


"*" indicates required fields