Introduction
While working with Tableau, it’s common to use date fields directly from the main data source for quick visualizations. This approach works well for basic charts and filters. However, when building more advanced time series analyses, such as Month-over-Month comparisons, Year-to-Date trends, or handling missing dates, a separate Date Table becomes essential.
Using a dedicated Date Table provides a complete and consistent timeline, supports cleaner time-based calculations, and allows for unified filtering across multiple data sources. This blog explores why a separate Date Table is a recommended practice in Tableau, the common issues it helps solve, and how to set one up for better control over your time-based reporting.
First, let’s talk about the shortcomings using the date column in dataset
1) Using the in-built date field from the main data table might seem fine at first, but it can cause several issues as the dashboard gets more complex.
2) Let’s consider an example, if there’s no data for a particular date or month, that date won’t even show up in your charts – making trends hard to understand.
3) Time-based calculations like Month-to-Date or Year-to-Date can also give incorrect results if the timeline isn’t continuous.
4) Filtering becomes a problem too, especially when using multiple data sources with different date fields, since there’s no single reference for dates.
5) On top of that, the date format can be inconsistent across all the different datasets, and you end up repeating the same calculated fields for date (like month name, quarter, or fiscal year) in every project.
Thankfully, there’s a simple fix! A separate date table helps avoid all this and gives you better control over your time analysis. Also, you can have customizable date tables as per your requirements. Let’s find out how.
Ever heard of the Date Table or Date Dimension, what is it exactly?
It is just a table that contains a full list of dates over a certain range, usually a few years – and includes additional fields like month name, quarter, year, week number, week start date, week end date and even holiday or working days. It acts as the single source of truth for all time-related analysis that you can connect to your actual data, even when no transactions happen on some days. The image below gives an example of it.
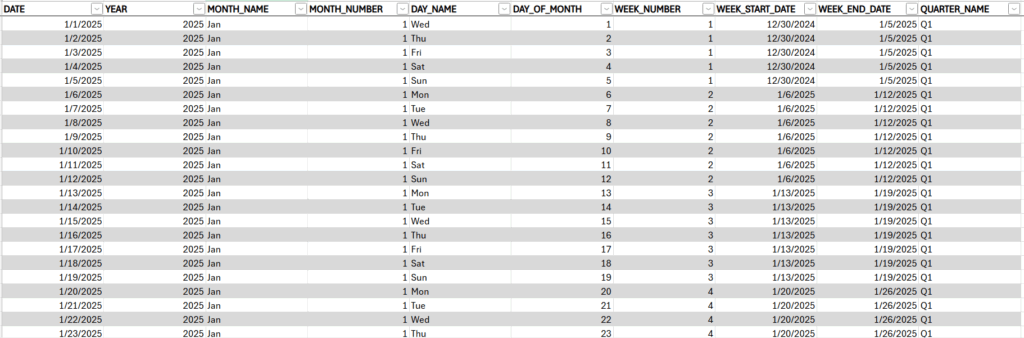
Figure 1: Excel date table
How do I create one?
The table above is a classic example of the data table (Also attached at the end of the blog). But you can create your custom table as per your requirements using Dimdates. It’s a generator which allows you to select the start date and end date along with various options to select from like Basics, Periods, Fiscal and many more. Along with that, there’s a preview option to view your data. Once you are good with it, you can download it in CSV format. Below is the image of the Date Generator.
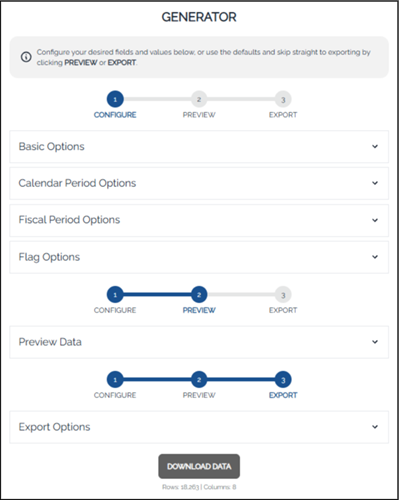
Figure 2: Online Date Generator UI
How do I use it?
Once your Date Table is ready and added to your Tableau data model, here’s how you can start using it in your dashboards:
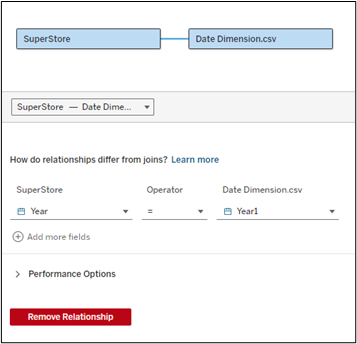
Create Relationships not Joins: In the Data Model drag your Date Table into the canvas and connect it to your fact table (like Sales or Orders) using the Date field. You can have a connection like Date-to-Date or Year-to-Year as shown above. Avoid using joins as relationships to preserve row-level detail and allow Tableau engine(hyper) to query efficiently.
Use Date Table Fields in Your Visuals: Start using fields from the Date Table like –Month Name on Columns (for charts), Year in Filters or Parameters, Quarter for summaries and Date for time series. This ensures that your visuals reflect a complete timeline, even when no data exists for certain dates.
Handle Missing Dates in Time Series: Using the Date Table’s continuous Date field ensures all dates are shown—even if there’s no matching data in your fact table. This is especially helpful for showing flat lines in months with no sales or any of your metrics or preventing broken trend charts.
Use Across Multiple Data Sources: If you have multiple datasets (Sales, Orders, Marketing), connect them all to the same Date Table. This allows for unified date filters, cross-source comparisons by time, and a cleaner dashboard design.
Common Mistakes to Avoid?
A short section on pitfalls could be valuable:
Avoid These When Using a Date Table
- Using JOINs instead of Relationships – may lead to row duplication
- Forgetting to mark the Date Table as a Date Role in Tableau
- Creating multiple Date Tables for different data sources
Bonus Suggestion?
Did You Know, you can publish the date table as a data source in Tableau Server or Tableau cloud, and use it whenever required.
Quick Summary?
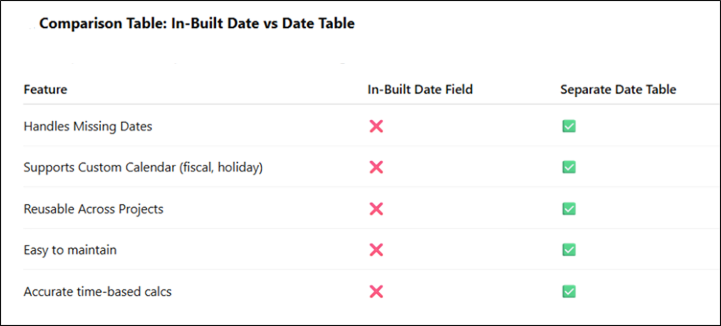
A separate Date Table is a simple addition that can make a huge difference in your Tableau dashboards. It brings consistency, flexibility, and accuracy to your time-based analysis. If you haven’t used one yet – try it in your next project and see the difference, it makes. Lastly refer this table of comparison for the quick summary
Need help building smarter, more reliable Tableau dashboards? click here.
At OnPoint Insights, we help businesses design scalable, user-friendly reporting solutions with best practices like custom Date Tables, data modeling, and advanced analytics.
Contact OnPoint Insights today and see how we can help your business operations reporting needs!
+1(978) 866 6776
For more insights, you can explore OnPoint Insights blog where we discuss various topics
References:
Figure 1 Table file: Data Dimension Table
Online Table Generator Link – https://dimdates.com/